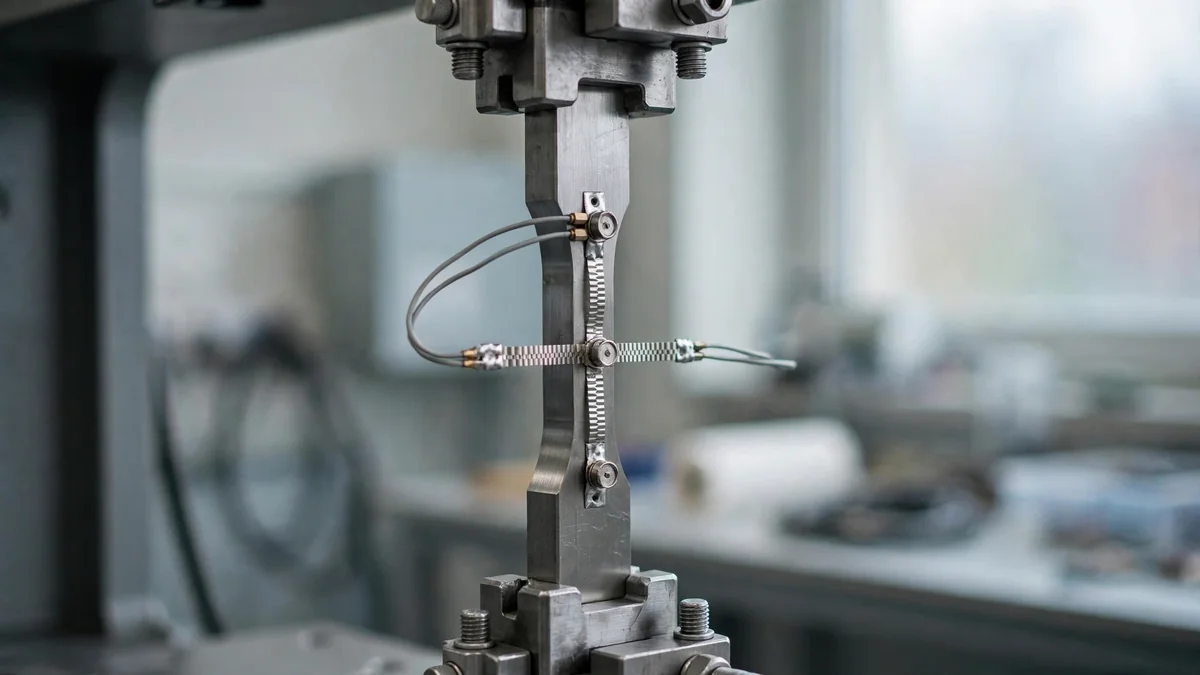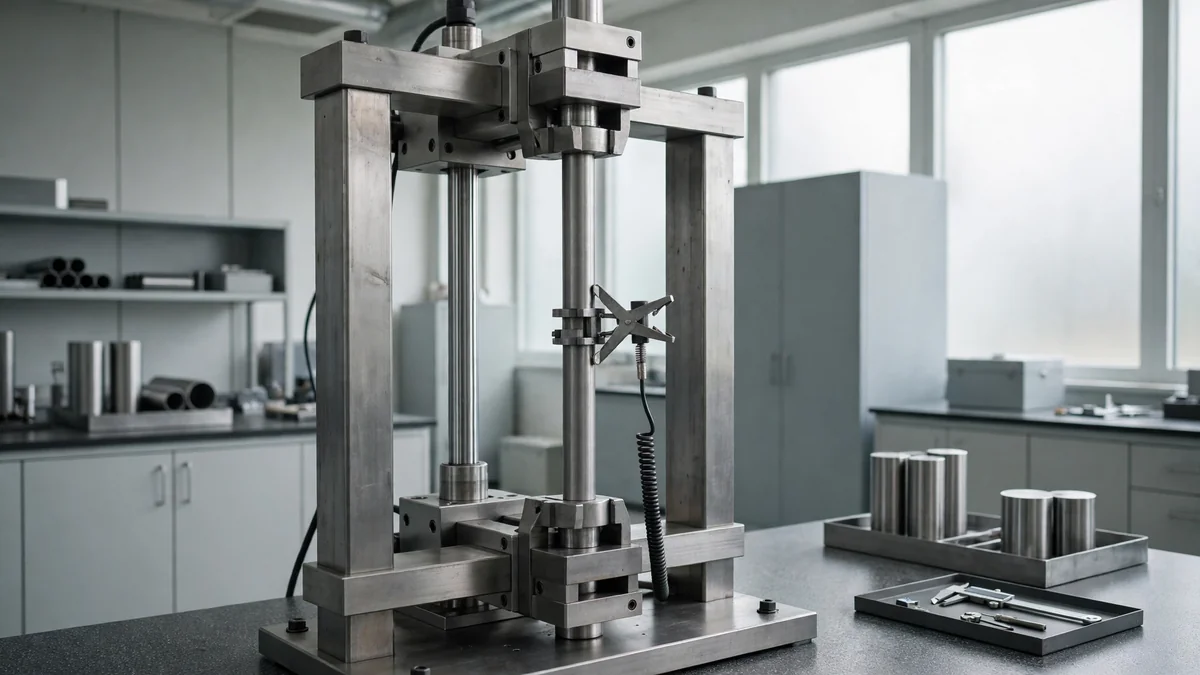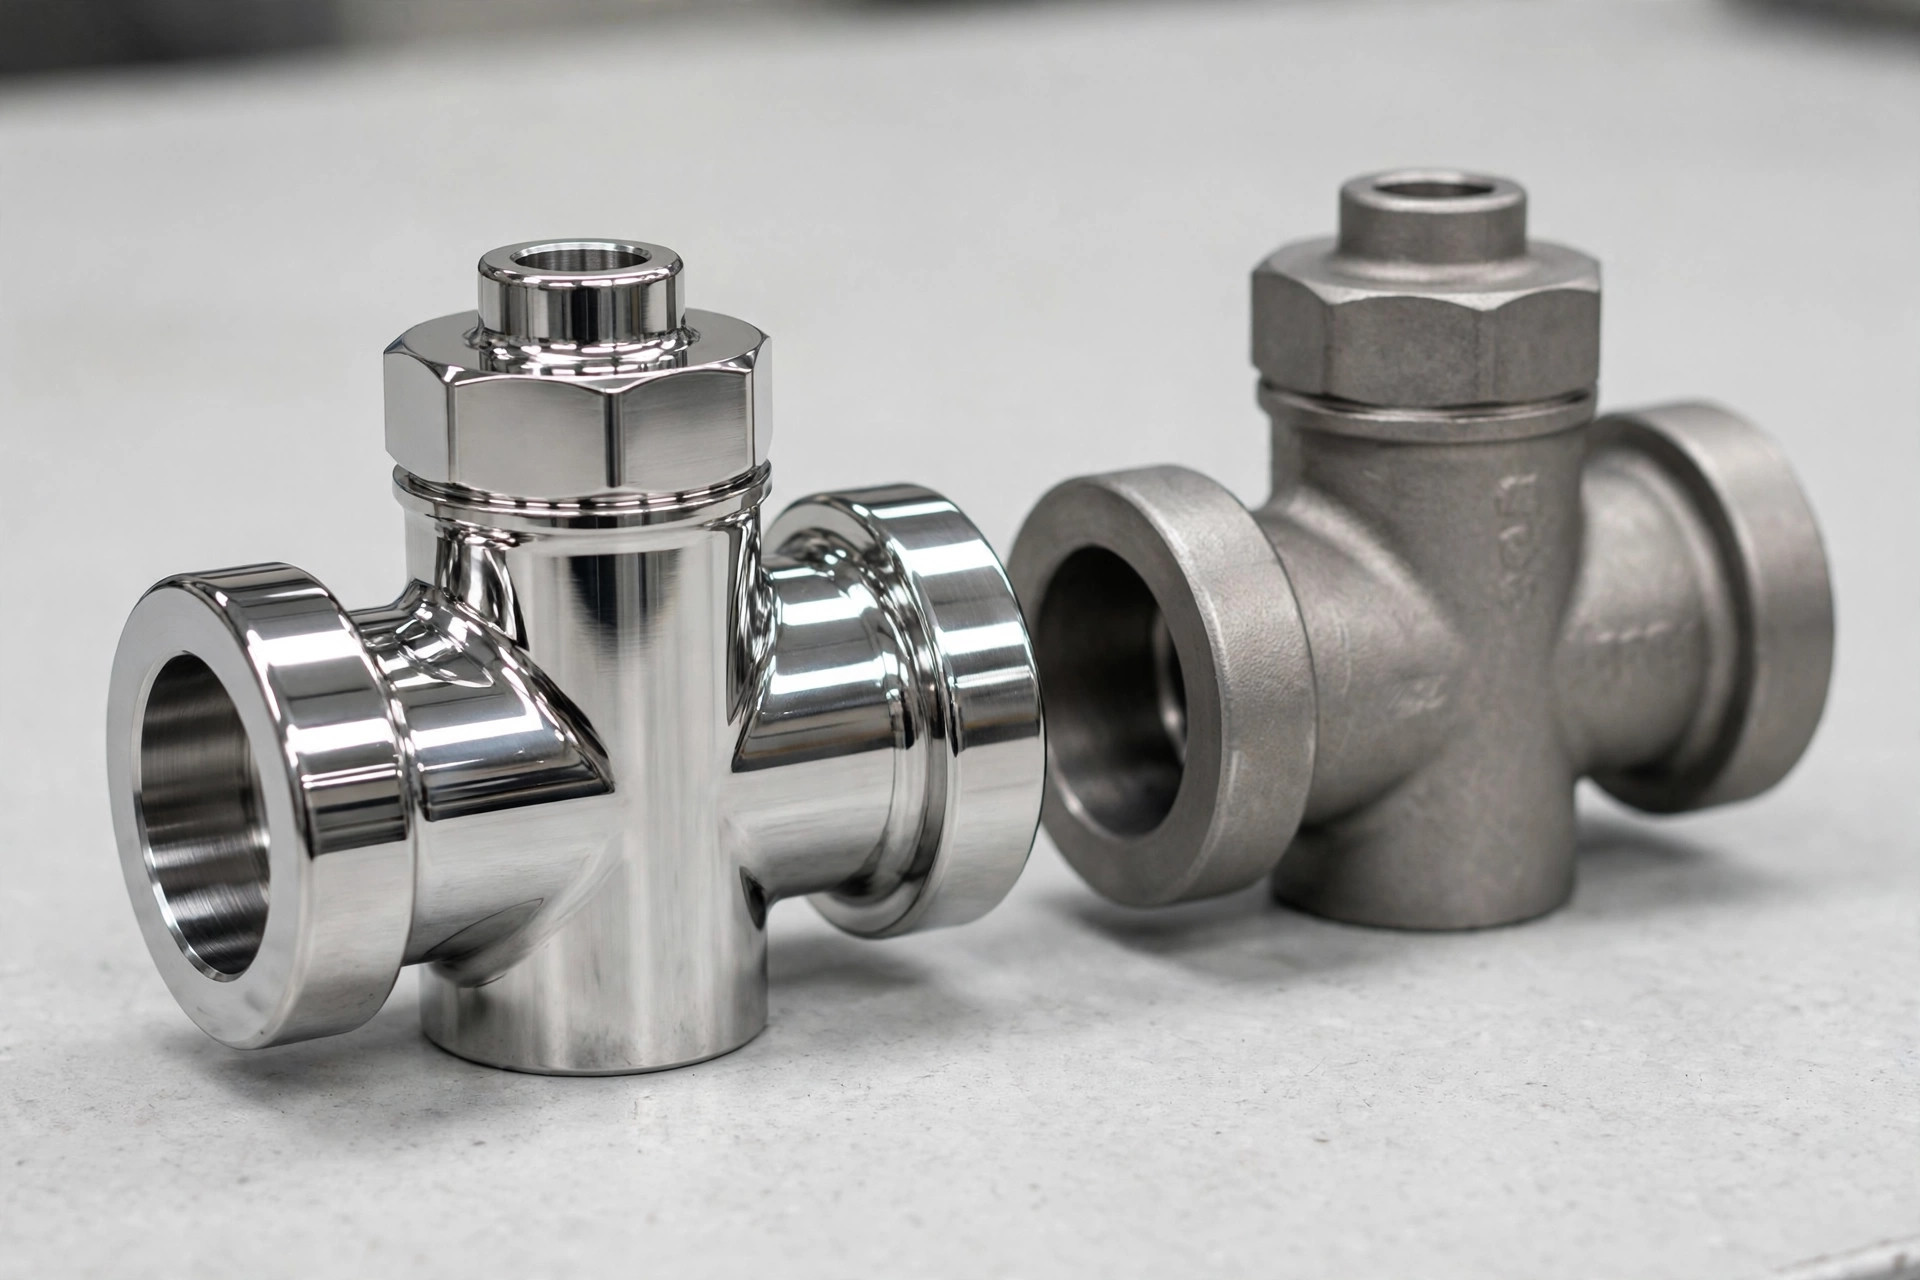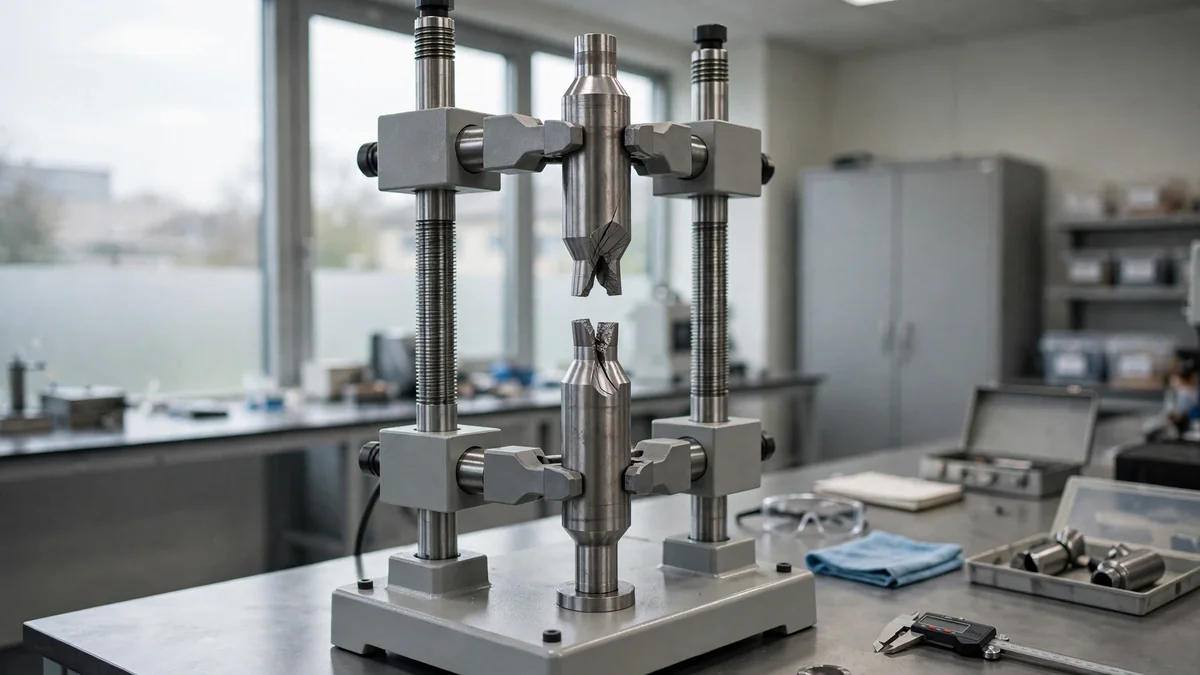
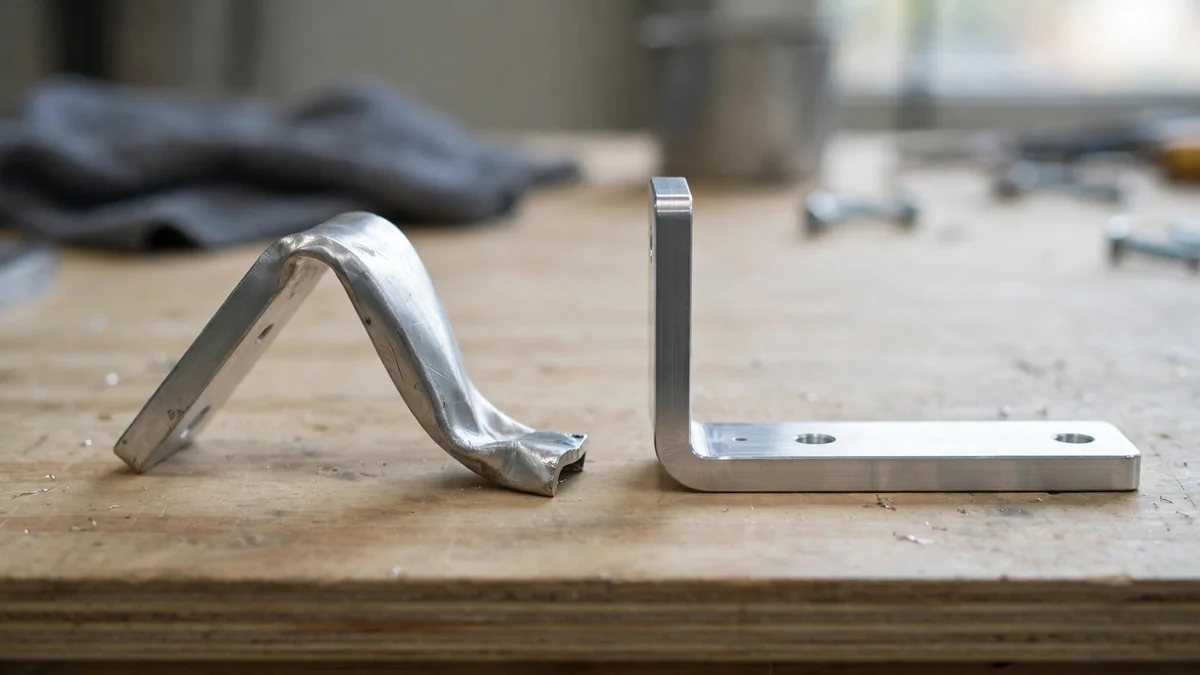
The difference between tensile strength vs yield strength comes down to two points on the same test curve. Yield strength is the stress at which a material starts to bend or stretch permanently. Tensile strength (ultimate tensile strength, or UTS) is the highest stress it can carry before it begins to neck and break. Yield always comes first, so yield strength is lower. For most machined parts, yield strength is the number to design with, because a part that has permanently deformed has usually already failed its job.
When you load a metal part, it first stretches elastically. Remove the load and it springs back to its original size. Keep increasing the load and you reach a point where some of the stretch stays. That is yielding.
Mild steel shows a clear yield point: the curve drops or flattens as the material gives. Aluminum, stainless steel and titanium do not. For those, yield strength is defined by convention as the stress that leaves 0.2% permanent strain, called the 0.2% offset yield strength.
The offset is found by drawing a line parallel to the elastic part of the curve, starting at 0.2% strain. Where that line crosses the curve is the yield strength. The procedure is set out in ASTM E8/E8M, Standard Test Methods for Tension Testing of Metallic Materials, the standard most US material certifications refer to.
Past the yield point, most metals keep getting stronger as they stretch. This is strain hardening. Eventually the stress reaches a peak. That peak is the ultimate tensile strength.
After the peak, the specimen starts to neck: a local section thins quickly, the load the bar can carry drops, and it fractures soon after. The stress at the moment of breaking is called the fracture strength, and for ductile metals it is lower than UTS when calculated on the original area.
Tensile strength is calculated as the maximum force divided by the original cross-sectional area: UTS = F_max / A₀.
| Yield strength | Ultimate tensile strength | |
|---|---|---|
| What it marks | Start of permanent deformation | Maximum stress before necking |
| Position on the stress-strain curve | End of the elastic region | Peak of the curve |
| Value | Always lower | Always higher |
| How it is found | Yield point or 0.2% offset | Maximum load ÷ original area |
| Main use | Design limit for parts that must keep shape | Failure margin, material comparison, quality checks |
| Typical spec symbol | Rp0.2, σy, Fy | Rm, σu, Fu |
The difference between yield strength and tensile strength is the gap between first permanent bending and final breaking. Both values are often quoted together on a data sheet. Tensile and yield strength values on the same certificate describe the same batch, and the yield strength and ultimate values show how much warning a part gives before it fails.
The values below are minimums from common material specifications or typical published values, the kind of data long compiled in references such as the NBS Circular 447, Mechanical Properties of Metals and Alloys (NIST). Strength depends heavily on temper, thickness and product form, so always check the mill certificate or the exact specification for your part.
| Material | Yield strength (MPa / ksi) | Tensile strength (MPa / ksi) | Yield-to-tensile ratio |
|---|---|---|---|
| Structural steel ASTM A36 (min) | 250 / 36 | 400 to 550 / 58 to 80 | about 0.45 to 0.63 |
| Stainless 304, annealed (ASTM A240 min) | 205 / 30 | 515 / 75 | about 0.40 |
| Aluminum 6061-T6 (typical) | 276 / 40 | 310 / 45 | about 0.89 |
| Aluminum 7075-T6 (typical) | 503 / 73 | 572 / 83 | about 0.88 |
| Titanium Grade 5, Ti-6Al-4V (ASTM B348 min) | 828 / 120 | 895 / 130 | about 0.93 |
Look at the last column. Annealed 304 stainless yields at only about 40% of its tensile strength, so it has a long plastic range and gives plenty of warning before it breaks. 7075-T6 and Ti-6Al-4V yield close to their peak strength. They are very strong, but there is little reserve between “bent” and “broken.” Our comparison of 6061 vs 7075 aluminum for CNC machining shows how this plays out when choosing an alloy, and the Grade 2 vs Grade 5 titanium guide covers the same question for titanium.
For most mechanical parts, yield strength matters more. A bracket that bends by 2 mm, a shaft that takes a permanent set, or a housing that distorts so a seal leaks has already failed, even though it has not broken. Designers therefore set working stress below yield, divided by a safety factor that suits the application (often 1.5 to 4 depending on the industry and load certainty).
Tensile strength takes the lead in other cases:
Our position: design to yield, check against tensile, and look at elongation too. A high-strength material with very low elongation may meet both numbers and still crack under impact.
Compressive strength follows the same logic in the opposite direction. A material with high strength in tension can be weak in compression, so the minimum yield value in compression is checked separately for columns and supports. The strength of materials as a subject covers all of these cases, and a higher yield usually means a higher breaking strength as well.
Stiffness is a separate property, covered in our guide to Young’s modulus.
The yield-to-tensile ratio (YS ÷ UTS) shows how much plastic reserve a material has. A ratio around 0.4 to 0.7, common in structural steel and annealed stainless, means the part will visibly deform long before it breaks. A ratio above 0.85, common in heat-treated aluminum and titanium alloys, means failure follows yielding more quickly.
Seismic and structural codes often cap this ratio for steel because they rely on ductility to absorb energy. For machined components, a high ratio is not a flaw. It simply means the design margin needs to come from the safety factor, not from the material’s warning stretch.
The ratio also describes the elastic to plastic behavior of the part. A low ratio means a long plastic range after yielding, while a high ratio means the material goes from elastic to broken with little bending in between. Under compression, the compressive yield value is usually close to the tensile one for steels, but the load needed to stress the material past yield differs greatly for cast iron and concrete.
These errors show up regularly in drawings and RFQs:
For parts where strength is critical, request material certificates with your order. Our quality assurance process includes mill certificate checks, and our CNC machining services cover steels, aluminum and titanium in the tempers listed above.
One more check is the yield strength vs tensile strength balance on the certificate itself. If the tensile strength tests show a value barely above yield, the batch has little reserve, and a lower yield than the certificate states would be a reason to reject it. Tensile strength measurements should always come from the same test piece as the yield value, so the two numbers describe the same material.
Yield strength is the stress at which a material starts to deform permanently. Tensile strength is the maximum stress it can withstand before necking and fracture. Yield happens first and is always lower. Engineers design parts to stay below yield, while tensile strength shows how much margin exists before breaking.
Yes. Yield marks the end of elastic behavior, and the material can carry more load after that point because of strain hardening. Tensile strength is the peak of the stress-strain curve, so it is always equal to or higher than yield. In very brittle materials, the two values are almost the same.
It is the stress that leaves 0.2% permanent strain after the load is removed. Many metals, including aluminum and stainless steel, have no sharp yield point, so this offset method gives a consistent, repeatable value. A line parallel to the elastic slope is drawn from 0.2% strain to find it.
Not always. Higher tensile strength usually comes with lower elongation and toughness, so the material may crack instead of bending under impact. It can also be harder to machine and more expensive. The best choice balances strength with ductility, stiffness, corrosion resistance and cost for the actual service conditions.
It varies by material. Structural steel often has a yield-to-tensile ratio of about 0.6, annealed stainless steel about 0.4, and heat-treated aluminum or titanium alloys about 0.85 to 0.93. A lower ratio means more plastic deformation, and more visible warning, before the material fractures.
Yield strength matters more for most parts, because a part that has bent permanently has already failed even if it has not broken. Tensile strength takes the lead for crash structures, brittle materials and fasteners, where breaking load is the limit. Design to yield, check against tensile, and look at elongation too.
Treat yield strength as the line your part should never cross in service, and tensile strength as the last line before fracture. Use specification minimums, state the temper on every drawing, and check elongation when impact or fatigue is possible. With those three habits, strength data does its job.
Need parts in a specific alloy and temper? Upload your drawing for a free instant quote, or visit Tuowei Precision to see our full range of materials and processes.